Author: astroryan.bsky.social (did:plc:4x7dicijfkpmqy42wqvlmrcs)
Collections
- app.bsky.actor.profile
- app.bsky.feed.like
- app.bsky.feed.post
- app.bsky.feed.repost
- app.bsky.graph.block
- app.bsky.graph.follow
- app.bsky.graph.listblock
- chat.bsky.actor.declaration
DID Doc
success:
true
identity:
@context:
alsoKnownAs:
verificationMethod:
type:
"Multikey"
controller:
"did:plc:4x7dicijfkpmqy42wqvlmrcs"
publicKeyMultibase:
"zQ3shYhTXmvfJBPVo7vK5nYdEJFzjrj1gP9UnnGWMokRneBdq"
service:
id:
"#atproto_pds"
type:
"AtprotoPersonalDataServer"
serviceEndpoint:
"https://puffball.us-east.host.bsky.network"
Record🤔
cid:
"bafyreid4vjararjkhinhogtqeb2j5ihtca6sevejvpgh7gsaauo35ky4xu"
value:
text:
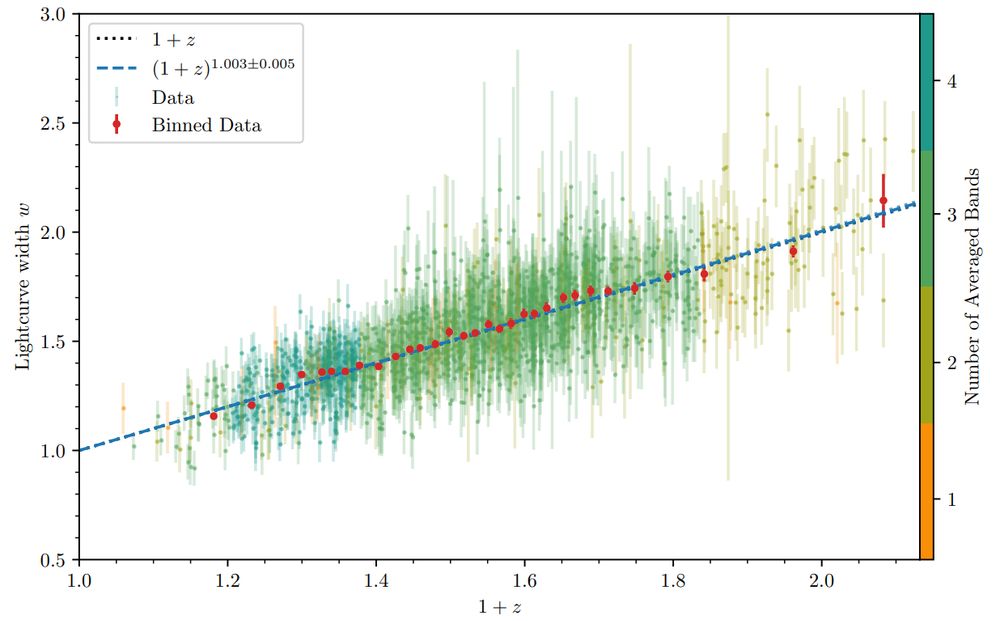
"Using most model independent method to find time dilation so far and the sheer number of high redshift SNe allow the most precise constraint on expansion induced time dilation: a factor of (1+z)^b, where we find b=1.003+/-0.015. This is what we expected, so cosmology can rest easy! 🔭
2/4"
$type:
"app.bsky.feed.post"
embed:
$type:
"app.bsky.embed.images"
images:
alt:
"A plot from the paper showing our estimated 'widths' of the 1504 Type Ia supernova light curves vs their redshift. There is a line of best fit going through the scatter plot showing our (1+z)^1.003 factor of time dilation detection."
image:
View blob content
$type:
"blob"
ref:
$link:
"bafkreibk5w3lt5tbnjhksno5bgx44bxdjyfnyskkiafg5fcdbdxvjjqnb4"
mimeType:
"image/jpeg"
size:
406366
aspectRatio:
width:
1236
height:
767
alt:
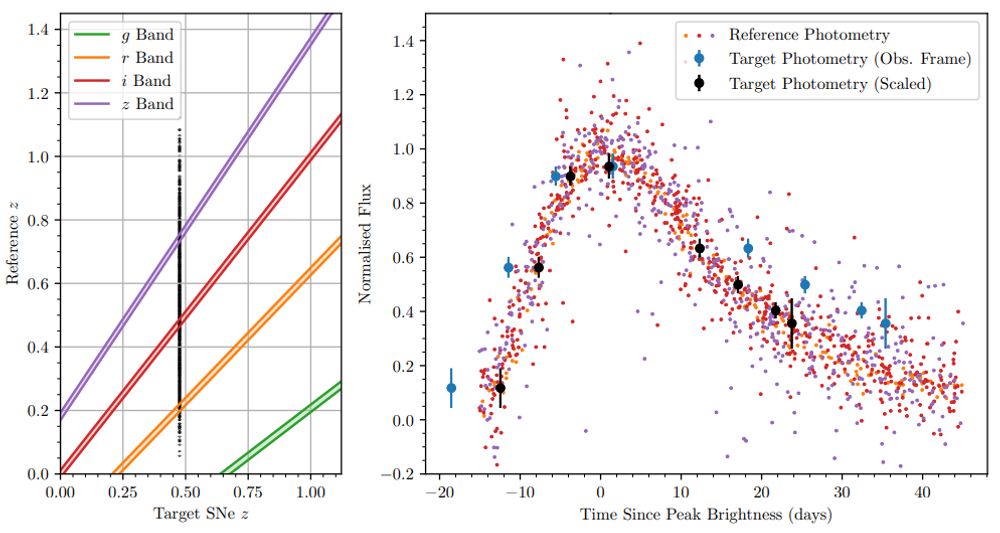
"A double plot, showing (left) our selection method of light curves to make a stacked 'reference' light curve, and (right) our method of finding the width of the data from an individual supernova light curve. On the right plot, the blue dots are the raw data from a single supernova, and the black dots are them scaled and corrected for the observed time dilation."
image:
View blob content
$type:
"blob"
ref:
$link:
"bafkreigkax33gj4xpwuogbsicbelzjtp47mv5k4syz2ptwd3s5p3doadvi"
mimeType:
"image/jpeg"
size:
346372
aspectRatio:
width:
994
height:
530
langs:
"en"
reply:
root:
cid:
"bafyreieznarwo6uywje46r7zdx4577dfmxcbnhjzk3t7sad2tnyffmf2zi"
parent:
cid:
"bafyreieznarwo6uywje46r7zdx4577dfmxcbnhjzk3t7sad2tnyffmf2zi"
createdAt:
"2024-06-19T23:15:23.367Z"