Author: priestleycentre.bsky.social (did:plc:cjijguqwnpkwxxhbycotyzju)
Record🤔
cid:
"bafyreiheauz45nr6fzplxfdbvaxack3iw5h33mfzootsdnzw5hl776p3ry"
value:
text:
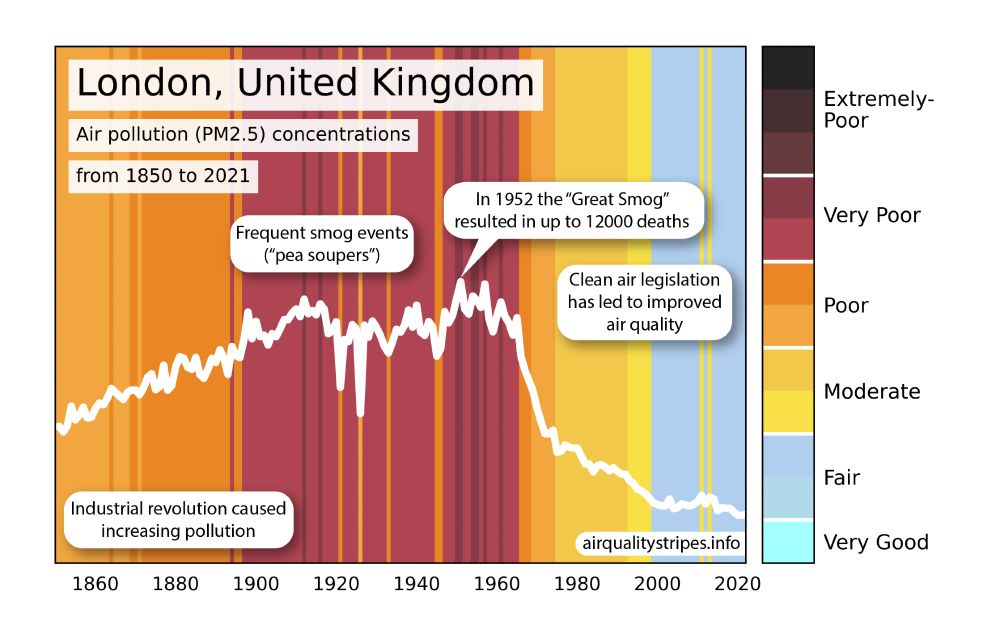
"Air pollution poses a major threat to both human health and the climate - but how can we visualise unseen air pollution? 💨🌍

Leeds researcher Jim McQuaid contributed to the creation of air quality stripes to confront ongoing air pollution challenges 👇

climate.leeds.ac.uk/new-images-r..."
$type:
"app.bsky.feed.post"
embed:
$type:
"app.bsky.embed.images"
images:
alt:
"A colourful graphic of “climate stripes" depicting particulate matter (PM) concentrations (air pollution) from 1850 to 2021 in London, UK. The graphic shows a poor score, rising to very/extremely poor due to the industrial revolution and highlighting the “Great Smog” (around 1900 – 1960) and then lowering to a moderate/fair score in the early 2000’s onwards when clean air legislation was introduced."
image:
View blob content
$type:
"blob"
ref:
$link:
"bafkreie64ymrfmihwl2sir4kczcnh5rf2hrm3egj37pb5abns2rjjdgyzm"
mimeType:
"image/jpeg"
size:
685373
aspectRatio:
width:
2000
height:
1268
langs:
"en"
facets:
index:
byteEnd:
301
byteStart:
266
features:
$type:
"app.bsky.richtext.facet#link"
createdAt:
"2024-09-05T08:42:09.263Z"