Author: zlabe.bsky.social (did:plc:nipoqrw2c5olbwkhy3bqxkiy)
Collections
- app.bsky.actor.profile
- app.bsky.feed.like
- app.bsky.feed.post
- app.bsky.feed.repost
- app.bsky.graph.block
- app.bsky.graph.follow
- chat.bsky.actor.declaration
DID Doc
success:
true
identity:
@context:
alsoKnownAs:
verificationMethod:
type:
"Multikey"
controller:
"did:plc:nipoqrw2c5olbwkhy3bqxkiy"
publicKeyMultibase:
"zQ3shwNMkY6whn66Hpaiwy53V58vVTCp5BcowXiRN2WJQb8F7"
service:
id:
"#atproto_pds"
type:
"AtprotoPersonalDataServer"
serviceEndpoint:
"https://amanita.us-east.host.bsky.network"
Record🤔
cid:
"bafyreigsagxmjbp7qs4deikbrnglybgb2m3dspefb5w53nw24et5pvgnlq"
value:
text:
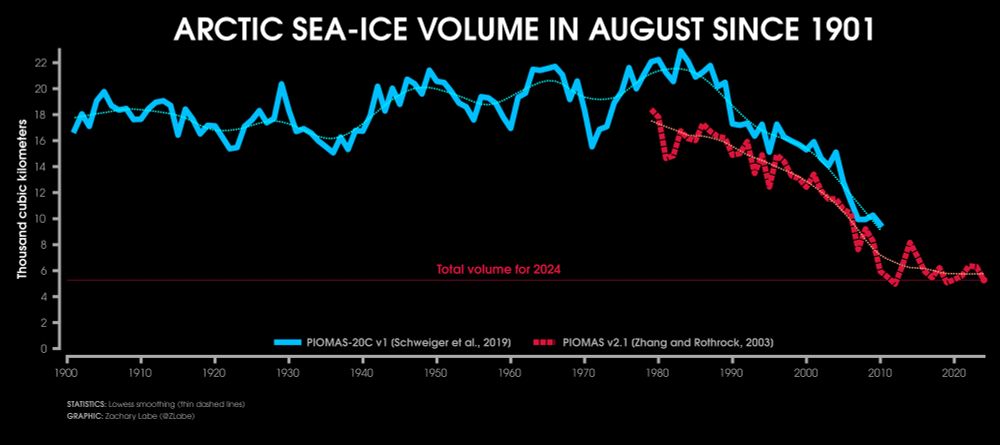
"Now showing average August #Arctic sea ice volume since the year 1901...

A high resolution version of this graphic can be downloaded at zacklabe.com/arctic-sea-i.... Comparison between PIOMAS-20C and PIOMAS datasets available at doi.org/10.1175/JCLI...."
$type:
"app.bsky.feed.post"
embed:
$type:
"app.bsky.embed.images"
images:
alt:
"Line graph time series for Arctic sea ice volume in every August from 1901 through 2024. Two datasets are compared between PIOMAS-20C (a blue line) and PIOMAS v2.1 (a dashed red line). There is large interannual variability, but a long-term decreasing trend since 1990."
image:
View blob content
$type:
"blob"
ref:
$link:
"bafkreih2ui43mrbda44wb3mgb3hpyaouy7g4epsyy7p7sp6qaognlvbjk4"
mimeType:
"image/jpeg"
size:
411247
aspectRatio:
width:
2000
height:
889
langs:
"en"
facets:
index:
byteEnd:
34
byteStart:
27
features:
tag:
"Arctic"
$type:
"app.bsky.richtext.facet#tag"
index:
byteEnd:
167
byteStart:
139
features:
$type:
"app.bsky.richtext.facet#link"
index:
byteEnd:
255
byteStart:
232
features:
$type:
"app.bsky.richtext.facet#link"
createdAt:
"2024-09-13T12:22:43.167Z"